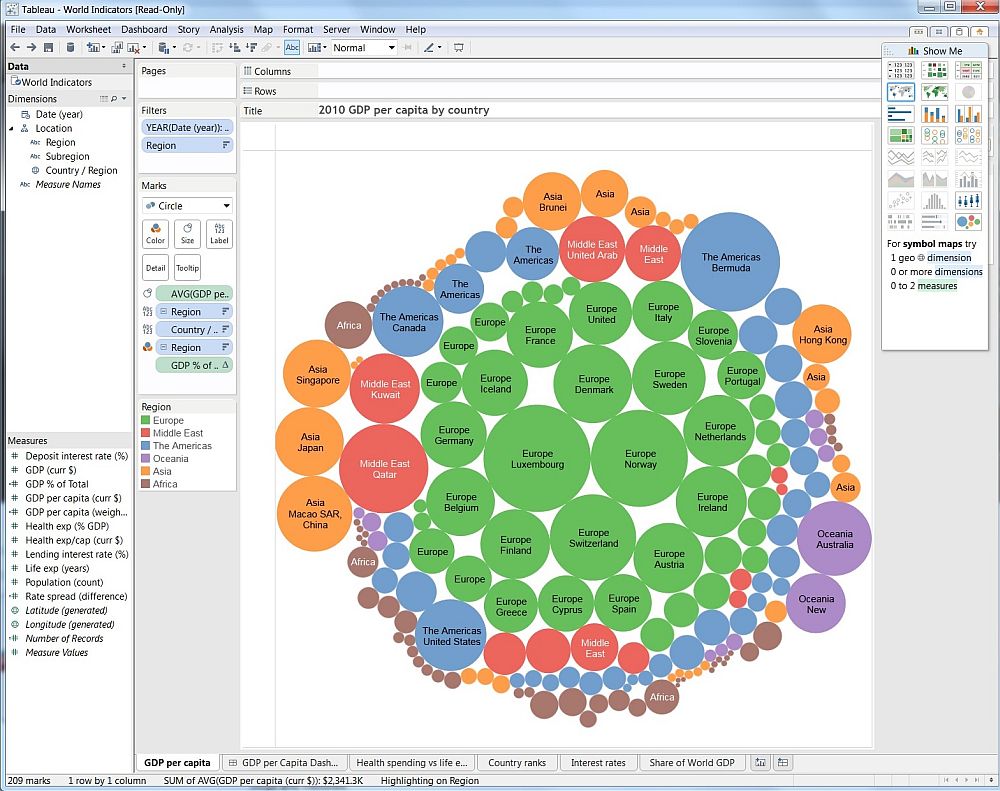
From a relatively unknown name a few years ago Tableau has quickly grown to be a Gartner Magic Quadrant Leader in the Data Visual Analytics space, taking on the well-established brands. The team has been working on the product for the past decade and now claims it has reached a point where it is simple enough for anyone to use. This has caught the interest of many well-known Indian companies (mentioned in this article), who now swear by Tableau.
DIGITAL CREED met Deepak Ghodke, Country Manager-India, Tableau and JY Pook, Senior VP, Asia Pacific, Tableau on the side lines of the Gartner BI Summit in Mumbai. They reveal the secret of their success and the core differentiators.
DC: There are two sets of people who are using analytics tools: the data scientists and business users. Which category does your tool cater to?
Deepak: There is room for data scientists but there is also a term that we have coined and it is ‘Data Enthusiast’. All of us are data enthusiasts — if I want to book a flight, I am going to do some analysis to find out where I can get the lowest airfares and best deals. It may involve just browsing travel and airline websites, but it is analysis. We make decisions today on data, but often the tools are not available to enable that analysis. An orthopaedic surgeon will also have multiple options for knee replacement but does not have the tools to make the choice. If that doctor actually had a tool, he could look at a lot of cases of past patients, and it would help him to make a decision. That’s better than just making an opinion.
The data scientist is trying to understand how the market clusters into different segments, and how much should I invest in each of those markets to get the best returns. It could be information about customer retention rates. And all this is very complex to understand. So they may use other software for this, but they still need an interactive, visualization tool to answer questions and frame hypothesis.
So we make it easy for the data scientist to go into the depths of analysis and present information, from which they can make a conclusion. And they need to be able to take that and to tell a story, with an example — and our tool also helps them to make that presentation.
So we help the data enthusiast as well as the data scientist to make a decision.
DC: What are the key things that a data analytics tool must have to make it easy for people to access and analyze data?
 Deepak: Data should be accessible. It should be easy to connect to the data regardless of whether it is in the cloud or in some Excel sheet. Our tool has 45 plus data connectors (to various data sources). I should not be able to always move it into a warehouse to access it.
The front-end is literally a visual query interface. In fact, the word Tableau means an empty canvass. Think of the paint as the different dimensions of data that I can simply drag and drop to get a picture of information. When you make it that simple then adoption automatically happens. Then the data enthusiast says, “I can do this too”.
The core technology enabling this visual depiction in Tableau is Visual Query Language. That’s the core differentiator of Tableau. And we have patents for this.
DC: Four or five years ago not many heard about Tableau. And there are other established players in the data visualization market. But you have grown very quickly and are now well-known. What are the factors that contributed to your success?
JY Pook: We have been working on this product for the last 11 years or so. This is a validation that we are doing the right thing in the market place. The key thing that we talk about is data visual analytics.
If you look at all the tools in the data visualization market, their interfaces look the same. The problem with the traditional tools is that they are just too complicated to use or too expensive.
The question is how fast can you get to the end result, and who gets to the end result?
With Tableau you get to the end result very fast. And who gets to it? The business. You don’t need IT specialists to do this. You should have the ability to answer questions about the data yourself, in a very visual way.
Deepak: When something is easy to use and beautiful to look at, it just spreads. And that’s how we became popular.
DC: Can you cite some examples of how you helped customers solve challenges with data? Can you name some of these customers?
Deepak: We have customers like Marico and Ashok Leyland who have been using Tableau for a long time. Then there are customers like Snap Deal, Eveready, Fast Lane, Crif High Mark, eClerx, RedMart and others.
In all of these instances, somebody from the business wants something and asks for a document; it takes 15 days to write this document and someone asks for two months to come up for the product. This is the problem that Tableau is solving. We are saying: Here’s the data, take it and do it yourself (self-service). The IT team becomes good data stewards to hold that information in the right place, and they can enable business decisions.
JY Pook: Business has a question and they need the answer. Rather than have someone who is not close to the business and data answering it for them they want the ability to answer it themselves.
—————————————————————————————————————————————
How Indian businesses are using Tableau
Source: Tableau communications team
eClerx, a leading knowledge process outsourcing (KPO) company, analyzes data for both internal users and clients. Before, it took four or more days to create a comprehensive, internal report. eClerx turned to Tableau to understand their own data—and to provide the best experience to their clients. eClerx stakeholders chose Tableau to create a unified view of the organization. Today, a centralized team manages data sources on Tableau Server, ensuring a single source of truth across the business.
Eveready Industries India, Ltd (EIIL) was keen to use its existing data to gain valuable insights, which would aid in better decision making. The company already had a data warehouse in place to store data generated from its ERP system, which was installed in 2005. It also had supply chain management and Salesforce systems in place, which generated considerable data. In total, the company had about three terabytes of data, most of it stored in an Oracle database. In addition, it also had some financial data stored in Microsoft Excel worksheets. The company decided to invest in a tool that would analyze data from its existing data warehouse and provide insights in a visual format. After evaluating available data analysis tools in the market, Eveready zeroed in on Tableau because of its simplicity and ease of use. These features enabled business users within Eveready to interact with the software very easily. The company’s IT team was also impressed with Tableau’s ability to provide simple visualization of complex data.
Marico chose Tableau for its ease of reporting. With Tableau deployed, Marico now has standardized reports in a clean PDF format and customized dashboards with vizzes reflecting all manner of KPIs for managers to get the insights they need out of the data. Tableau has also offered Marico significant cost savings.
RedMart, a Singapore-based online grocery marketplace has been using Tableau across various departments within the company including merchandising and commercial, marketing, customer service, corporate development and finance. Tableau helped the company improve customer service, business efficiencies, and operations. Using Tableau and Amazon Redshift, RedMart has been able to:
- Cut down the time spent on analysis to about one fourth of the original
- Gain real-time visibility into data, facilitating quicker decision making
- Reduce report creation timelines from days to hours
Ashok Leyland was already using other BI tools for its reporting capabilities, but these tools had limitations in terms of providing a dashboard facility that the business was looking for. Rather than a transactional, hygiene reporting tool, the company was keen to invest in a ‘self-service’ insights tool that would provide deep, specific insights that a user could slice and dice as required.
“We knew that if we hoped to proliferate an information culture across the board and democratize information access, we needed an analysis and insights tool that has a self-service functionality, interactive features and is user friendly,” said Venkatesh Natarajan, VP Information Technology. “Also, pictorial depiction always provides a much better 360 degree insight rather than a tabular format. So, the tool needed to enable that.”
“We looked at Tableau not as a reporting tool but rather as an insight tool. Basically, we want our employees to become data scientists who can visualize the kind of information they need and demand it from the organization. Stimulating a cultural transformation that encourages people to think deeper was a primary objective of the digital transformation,” said Natarajan.
—————————————————————————————————————————————–


